
Barack Obama is getting his strongest support from states that have low rates of obesity. States with high levels of obesity are supporting the opposing candidate, John McCain. The presidential election is shaping up as a battle of obese states vs. Obama states.
And this isn’t just one of those “gee, isn’t that funny” connections. When you look state by state, obesity and Obama support are so distinctly separated that it couldn’t be an accident. There has to be a cultural explanation for it, something to do with the way voters understand their lives and the world around them.
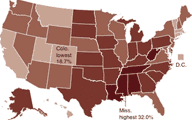
The minute I saw yesterday’s AP map of obesity rates from the 2007 survey conducted by the Behavioral Risk Factor Surveillance System (BRFSS) of the Centers for Disease Control and Prevention (CDC), I could see that there was a connection between being fat and voting Republican. The dark red states on that map, indicating adult obesity rates above 29 percent, are also red states on the current electoral map, indicating support for John McCain in the presidential election. And the 10 lightest states on the obesity map, indicating obesity rates below 23 percent, mostly support Obama. Seven of those 10 states are dark blue on the electoral map, indicating the strongest support for Obama, and only one is a McCain state.
You can make the connection just by glancing at the thumbnails below. The map on the left is the AP obesity map. The darker reds are states with higher obesity levels. The map on the right is today’s electoral map from Electoral-vote.com. Reds are states that support McCain in the most recent polls. Blues are states that support Obama.

You can almost pick out the political leanings of a state in the obesity map. Look at the two bands of states that have been Republican strongholds in recent years, from the Dakotas to Texas and from Texas to the Carolinas. These 14 states are also strongholds of obesity, with obesity rates in the upper half, ranging from 26 percent (Nebraska) to 32 percent (Mississippi).
Looking more closely at the data, I found that this correlation is even stronger than it appears on the surface. To show how strong the correlation is, using the same two data sources, I ranked the states by obesity rates, from lowest to highest, then colored the states according to the seven electoral poll levels used by Electoral-vote.com. You can see that most of the states toward the left, with lower than average obesity, are solid blue strong Obama states, while there is a cluster of red McCain states at the right with the highest obesity levels.

What does all this mean? Are McCain voters fat? No, while it might seem that way, it would be an oversimplification to draw that conclusion from this data. It does seem safe to say, though, that McCain draws most of his support from areas where especially large numbers of people are obese, while Obama is the overwhelming favorite among areas where obesity is less common. And although I can’t pinpoint the link between obesity and voting for one candidate or the other, it is absolutely clear from the data that there is some kind of connection.